Product benchmarking is the process of measuring and analyzing the performance of competitive products. Data from a benchmarking analysis is used at the early stages of product development where performance targets are being set for a new vehicle. As an example of benchmarking, consider setting the mass target for the body structure of a new vehicle program. We want to set a target that is light weight, but also one that is possible to achieve. We benchmark two competitive body structures to help us set the target, Figure 1.

Figure 1: Mass data for two benchmarked vehicles.
From this limited data, it appears a sufficient target for the new program would be 300 kg, the lighter of the two. But there are questions to be resolved: Are these two structures representative of efficient light weighting? Also, if the vehicle under design is of a slightly different size than these two vehicles, how will this affect the applicability of benchmark comparison?
A means to begin to address these concerns is simply to look at more benchmark vehicles. The tear-down database at A2Mac1 Automotive Benchmarking contains mass data for several hundred vehicles. From this database, structure mass for 280 steel sedans is plotted in Figure 2. This expanded data allows us to see a more complete picture of the range of mass exhibited in the market place. Vehicle A and B considered before no longer stand out as exceptional. While this additional data provides an understanding of the average and range of body structure mass, there are concerns with interpreting this chart. Do the lighter structures represent efficient designs or are they just the structures of smaller vehicles?
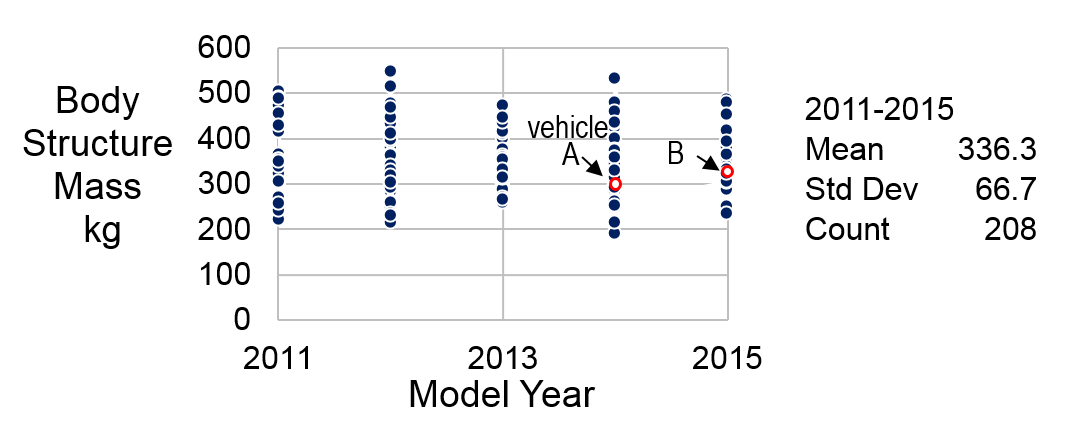
Figure 2: Body structure mass data for 280 benchmarked vehicles.
We can answer this question by investigating how structure mass varies with mass drivers. Two mass drivers for body structure are vehicle size as measured by plan view area, and structural loading taken to depend on the Gross Vehicle Mass. In Figure 3 we use the same vehicles shown in Figure 2, but now plot structure mass versus each mass driver.
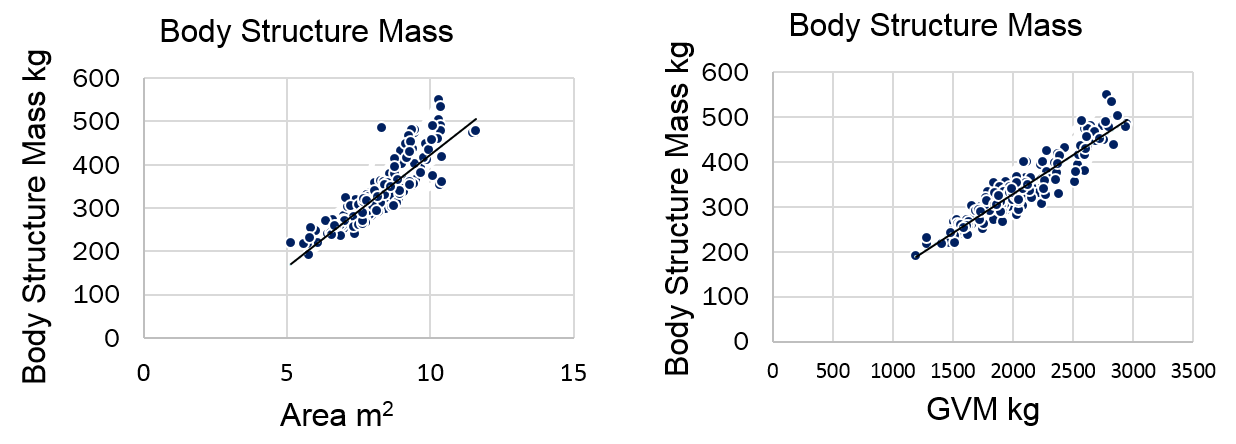
Figure 3: Structure mass vs. vehicle plan view area (left), and gross vehicle mass (right).
The correlation of structure mass for each of these mass drivers is very clearly demonstrated by the trend lines shown: Body structures are heavier for larger cars (left graph), and heavier when they must support greater vehicle mass (right graph). We can quantify these correlations with an equation determined by statistical regression, Equation 1. This equation represents the mass of an average or typical body structure, given its GVM and Area.
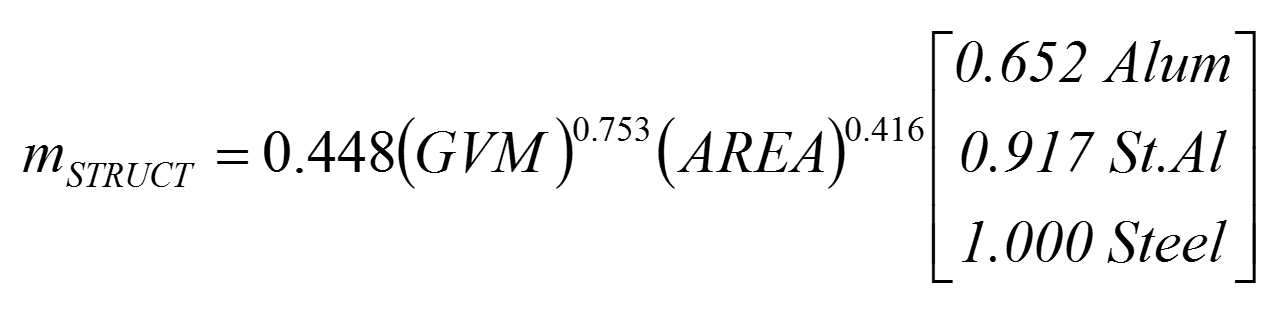
Equation 1
where
mSTRUCT=Mass of body structure (kg)
GVM =Gross vehicle mass (kg)
Area =Plan view area (Length x Width) (m2)
Now for each of the vehicles in our original data set we can calculate the expected structure mass using the vehicle’s GVM and Area. Figure 4 plots the actual measured structure mass vs. the mass expected for that vehicle using Equation 1. The diagonal line indicates those vehicles where the body mass is average or typical. For those structures above the line, body mass is heavier than expected given the area and GVM of the vehicle. And for those below the line, body mass is lighter than expected. This group below the line are the mass efficient body structures that are of interest for fuller analysis.
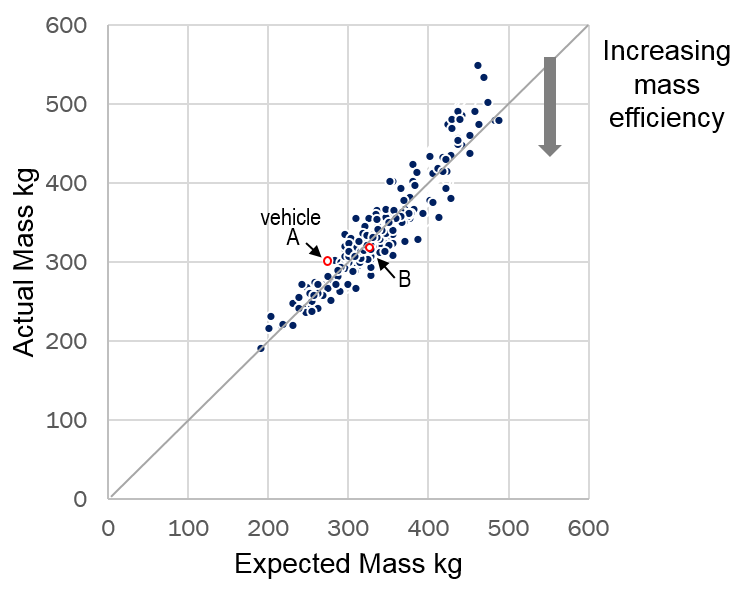
Figure 4: Actual measured structure mass compared to that expected using equation 1.
Note that looking only at structure mass, as in Figure 2, does not lead to understanding which structures are efficient. For example, Vehicle A in Figure 1 is the lighter of the two structures, 300 kg vs. 325 kg. However, after accounting for the two vehicle’s area and GVM, it can be seen from Figure 4 that Vehicle A is above the diagonal line, indicating a heavier than expected structure, while Vehicle B is on the line indicating it has a typical structure mass.
As a further example, consider the WorldAutoSteel FutureSteelVehicle (FSV). The FSV project, completed in 2011, investigated the weight reduction potential enabled with the use of Advanced High-Strength Steels (AHSS), advanced manufacturing processes, and the use of computer optimization. The resulting material use and body structure mass are shown in Figure 5.
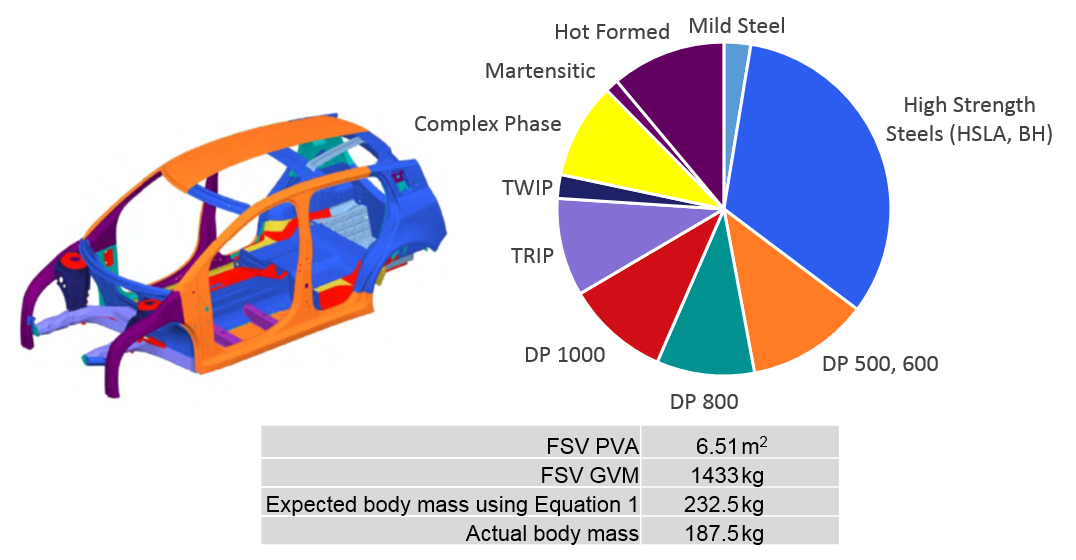
Figure 5: FSV material application and resulting body structure mass.
We can now graph the actual FSV structure mass with expected mass, Figure 6. The data point is well below the diagonal line quantifying the exceptional mass reduction enabled through extensive AHSS use.

Figure 6: FSV body structure compared with 280 normalized benchmarked structures.
Finally, statistical benchmarking reveals which current products would benefit most from lightweighting. Looking again at the plot of actual vs. expected body structure mass for a fixed expected mass, in this case 300 kg, Figure 7. For this set of similarly sized vehicles, there is a wide range of variability in actual mass, indicated by the arrow. For the several vehicles above the diagonal, these body structures are heavier than expected and have significant potential for lightweighting.

Figure 7: Variability in structure mass for similar size vehicles.
For more information on the statistical benchmarking method, see the studies referenced in No. 2 and 3 below. Dr. Malen’s statistical benchmarking methodology also is documented in SAE Paper No. 2015-01-0574
References:
1. A2Mac1.com, Automotive benchmarking.
2. Malen, D., Nagaraj, B., Automotive Mass Benchmarking 2017 study
3. Hughes, J. & Malen, D., Statistical Benchmarking of Automotive Closures, Great Designs in Steel, 2015,
4. FutureSteelVehicle Overview Report, April 2011,

Dr. Donald E. Malen University of Michigan
Dr. Donald E. Malen is an adjunct faculty member at the University of Michigan where he teaches graduate level courses in Automobile Body Structure and Product Design. Prior to this, he was an engineer with General Motors Corporation for 35 years. His background at GM was in automotive body structure design and analysis, and systems engineering. While at GM, he worked on many new vehicle programs and has brought this experience to his teaching and writing. Dr. Malen consults and conducts international seminars on Body Engineering, Innovation, Lead Time Reduction, and Decision Making During Preliminary Design. He holds several patents related to automobile body structure and vibration. His education includes a Ph.D. in Mechanical and Industrial Engineering from the University of Michigan, an MS from Massachusetts Institute of Technology, and a BSME from General Motors Institute (Kettering University).
Congratulation, Great article. We would like to know if Dr. Allen has a webinar about body structure. I’m a professor and our students need this information.
That’s a good question. I know he actively teaches at UM in the engineering school. I will ask.
Hello again. I spoke with Don Malen who was at a conference this week, and he said that there are no webinars or videos in the public domain. They are all housed in the University of Michigan online courses. He did recommend you click the links in the sources above for more information. Additionally, Dr. Malen published a book that is available at SAE called Fundamentals of Automobile Body Design, which you can purchase here: https://www.sae.org/publications/books/content/R-394
I hope this helps. If you have any specific questions, please do ask them here.
Thank you for your answer. Please, sentdmy regards to Dr. Malden. We will request the book.soon