Blog, homepage-featured-top, main-blog
The rule of thumb estimates used in 1989 during my internship with an automotive stamping supplier were simple calculations for the peak load. Tonnage for trim and pierce operations depended on the length of line of trim, material thickness and the shear strength of the material. Tonnage for forming operations depended on the size of the form, material thickness and material tensile strength. These calculations typically over-predicted the tonnage requirement, but due to the relatively low strength compared to AHSS, the overall part size that dictated the required press size became the limiting factor rather than the tonnage requirement.
Applying these same rules of thumb to the advanced steels in use today will likely under-predict the tonnage requirements. To understand why, let us examine the guidelines I used over 30 years ago.
For piercing a hole: Tonnage = d * t * 80 Equation 1
In this equation d is the punch diameter in inches, t is the material thickness in inches, and it calculates tonnage in tons. This was a simple and effective way to estimate the tonnage of all the holes pierced. Equation 1 is a simplification of the proper calculation being the length of line doing the work, in this case the circumference of a circle, multiplied by the sheet thickness and the material’s shear strength (ꚍ). The generic equation for any type of piercing or trimming is Tonnage = P * t * ꚍ where P is the perimeter or length of line of the trim, t is the sheet thickness and ꚍ is the shear strength of the material. A typical estimate for the shear strength (ꚍ) of mild steel is 60% of the tensile strength (T). Therefore, the equation development for a simple hole piercing looks like:
| Generic trim equation: |
Tonnage = P * t * ꚍ |
Equation 2 |
| Specific for a round hole: |
Tonnage = πd * t * 0.6T |
|
| Simplifying: |
Tonnage = d * t * 0.6Tπ |
|
| Mild steel T = 300 MPa = 43.5 ksi: |
0.6 * 43.5 * 3.14 = 82 |
|
| Pierce a round hole: |
Tonnage = d * t * 80 |
|
Knowing how the rule of thumb was derived allows us to highlight some possible sources of error. First, the equation assumes trimming of the full thickness. In reality, a typical trim operation for steel consists of 20% to 50% trimming and the remainder is breakage. The press needs to apply load only for the trimming portion. Second, shear strength is not a fixed percentage of tensile strength. The actual shear strength should be measured for each specific grade as the microstructure differences of the AHSS will affect the material strength in shear. Lastly each of these errors are multiplied since today’s AHSS material has a tensile strength of three to five times that of mild steel. To see this, we can consider a simple example of piercing a 1-inch hole in 0.06 inch (1.5 mm) thick mild steel. Mild steel tensile strength typically ranges from 40 ksi to 55 ksi (280 MPa to 380 MPa). Looking at Equation 1 relative to Equation 2 with low- and high -end assumptions:
| Equation 1 estimate |
Tonnage = 1 * 0.06 * 80 = 4.8 tons |
| Equation 2 minimum |
Tonnage = 3.14 * 0.06(20%) * 0.6(40) = 0.9 tons |
| Equation 2 maximum |
Tonnage = 3.14 * 0.06(50%) * 0.6(55) = 3.1 tons |
This simple example shows sources of error that could lead to an estimate ranging from 0.9 to 4.8 tons to pierce a single hole. A similar exercise could apply to a drawing operation. In this situation, most rules of thumb attempt to use the perimeter or surface area of the part, the material thickness and the material tensile strength to predict the tonnage needed. Sources for error in this type of calculation include: 1) Using the perimeter of the draw area, tending to under-predict; 2) Using the surface area of the part, tending to over-predict; and 3) Using the tensile strength of the material, also tending to over-predict as it assumes the material is stretched right to the level of splitting. Correction factors have been developed over time, but it is still easy to see there are many possible sources of error in these types of calculations.
AHSS Magnifies Press Tonnage Prediction Challenges
A number of reasons explain why the inherent challenges with old-school rules of thumb are exaggerated with AHSS:
- Strength: The strength of today’s cold stamped steels is quite incredible. Where a mild steel may have a tensile strength of 280 MPa, it is now common to cold stamp dual phase (DP) steels and 3rd Generation steels with up to 1180 MPa. In addition, new materials having a tensile strength of 1500 MPa with enough elongation to allow for cold stamping are starting to enter the market. This five-fold increase in strength acts as a multiplying factor for any errors in traditional predictions.
- Formability: The formability of AHSS has also increased dramatically. Today a DP 590 steel and even a 980 3rd Generation steel can have nearly the same elongation as a high-strength low alloy (HSLA) steel of 30 years ago. This affords the part designers the ability to incorporate more complex forms into a part including using darts and beads to increase a part’s stiffness, tight radii and deeper draws. All of these add to the tonnage used and are generally not part of the old school rule of thumb calculations.
- Springback Corrections: Springback is linearly related to the yield strength of a material. Therefore, stamping AHSS grades require more features to be added to the die process to control springback. These may include draw beads (used to control material flow early in the press stroke), stake beads (used at the bottom of the stroke to minimize springback) and tighter radii (Figure 2). These features are typically off product, in the addendum, and are easily ignored by typical rule of thumb calculations.

Figure 2: Draw and Stake Bead PlacementA-6
- Hardening Curves: The complex microstructure of AHSS offers many advantages to increase formability. All AHSS grades produce microstructural phase transformations during the stamping process. This allows the lower yield strength in the as-rolled material, which aids in formability, to increase during the stamping operation. This yield strength increase can be as much as 100 MPa. Models that estimate these hardening curves of the material are ignored when doing hand calculations.
- Other Considerations: Lastly the typical rule of thumb calculations, as we have discussed, only consider the part characteristics. They generally do not include the other sources that consume energy during the stamping process including off-product feature (beads, pilot holes, etc.), spring stripper pressure, pad pressure from nitrogen springs or air cushions, driven cams and part lifters. Many of these could be ignored 30 years ago with mild steels, but they become more significant with the strength of today’s AHSS.
Next Steps
Accurately predicting press requirements is a decades-long, industry-wide issue. Auto/Steel Partnership (A/SP), a partnership between automotive OEMs, steel mills and affiliate suppliers, teamed up with formability software suppliers to improve press tonnage prediction accuracy. A/SP’s efforts, including this project, looks to bridge the gap between research laboratories and the shop floor.
Stamping companies should keep press tonnage monitors in good working order, and upgrade to systems that can capture full through-stroke force curves. Engaging with organizations like A/SP, OEMs and steel mills, allows efficient information sharing and capturing best-practices. Get the steel mill involved early, even in the die design phase. All steel mills have teams of application engineers to help OEMs and their suppliers transition into using the newest grades of steel – they want stampers to succeed and have the tools and data to help.
Read more about Press Tonnage Prediction in the expanded article.
Blog, homepage-featured-top, main-blog
Advanced High-Strength Steel (AHSS) products have significantly different forming characteristics and these challenge conventional mechanical and hydraulic presses. Some examples include the dramatically higher strength of these new steels resulting in higher forming loads and increased springback. Also, higher contact pressures cause higher temperatures at the die-steel interface, requiring high performance lubricants and tool steel inserts with advanced coatings.
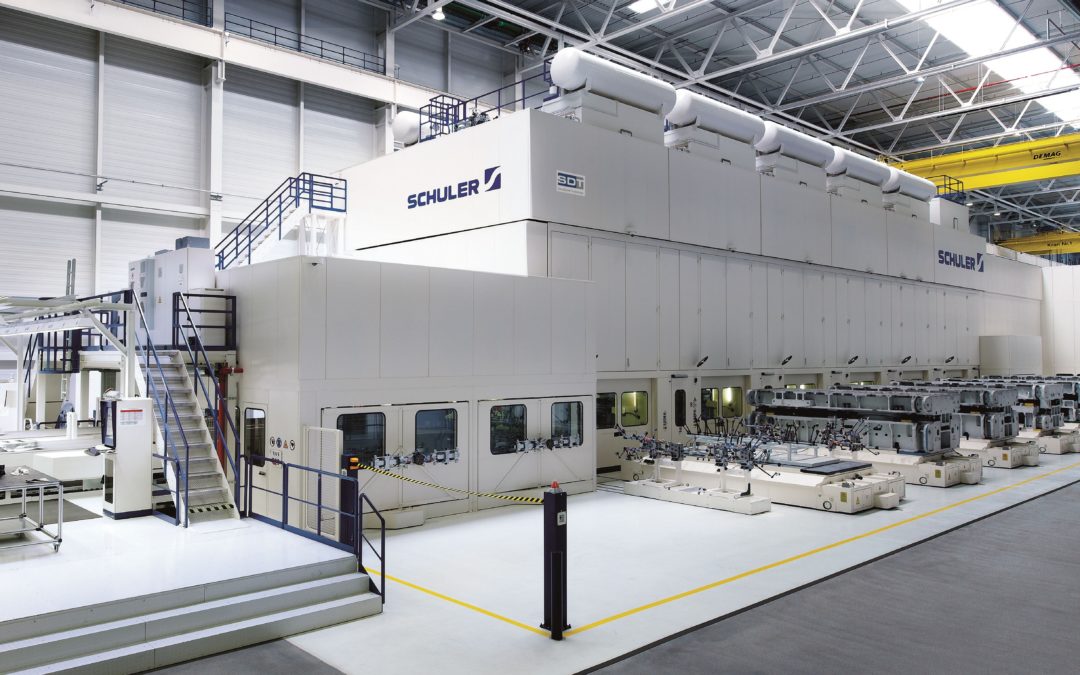
These and other challenges lead to issues with the precision of part formation and stamping line productivity. Using a servo-driven press is one approach to address the challenges of forming and cutting AHSS grades. Recent growth in the use of servo presses in the automotive manufacturing industry parallels the increased use of AHSS in the body structure of new automobiles. Click to read more about the Characteristics of Servo Presses and their Advantages.
Figure 1 shows the difference between the available motions of flywheel-driven mechanical presses verses servo driven mechanical presses. The slide motion of the servo press can be programmed for more parts per minute, decreased drawing speed to reduce quality errors, or dwelling or re-striking at bottom dead center to reduce springback.

Figure 1: Comparison of Press Signatures in Fixed Motion Mechanical Presses and Free-Motion Servo-Driven Presses.M-3
Press Force and Press Energy
Categorizing both mechanical and hydraulic presses requires three different capacities or ratings – force, energy, and power. Historically, when making parts out of mild steel or even some HSLA steels, using the old rules-of-thumb to estimate forming loads was sufficient. Once the tonnage requirements and some processing requirements were known, stamping could occur in whichever press met those minimum tonnage and bed size requirements.
In these cases, press capacity (for example, 1000 kN) is a suitable number for the mechanical characteristics of a stamping press. Capacity, or tonnage rating, indicates the maximum force that the press can apply without damaging its components, like the machine frame, slide-adjusting mechanisms, pitman (connection rods) or main gear bushings.
A servo press transmits force (not energy) the same way as the equivalent conventional press (mechanical or hydraulic). However, the amount of force available throughout the stroke depends on whether the press is hydraulic or mechanically driven. Hydraulic presses can exert maximum force during the entire stroke as tonnage generation occurs via hydraulic fluid, pumps, and cylinders. Mechanical presses exert their maximum force at a specific distance above bottom dead center (BDC), usually defined at 0.5 inch. At increased distances above bottom dead center, the loss of mechanical advantage reduces the tonnage available for the press to apply. This phenomenon is known as de-rated tonnage, and it applies to conventional mechanical presses as well as servo-mechanical presses. Figure 2 shows a typical press-force curve for a 600-ton mechanical press. In this example, when the press is approximately 3 inches off BDC, the maximum tonnage available is only 250 tons – significantly less than the 600-ton rating.

Figure 2: The Press-Force curve shows the maximum tonnage a mechanical press can apply based on the position of the slide relative to the bottom dead center reference distance. This de-rated tonnage applies to both conventional mechanical presses as well as servo-mechanical presses.E-2
Press energy reflects the ability to provide that force over a specified distance (draw depth) at a given cycle rate. Figure 3 shows a typical press-energy curve for the same 600-ton mechanical press. The energy available depends on the size and speed of the flywheel, as well as the size of the main drive motor. As the flywheel rotates faster, the amount of stored energy increases, reflected in the first portion of the curve. The cutting or forming process consumes energy, which the drive motor must replenish during the nonworking part of the stroke. At faster speeds, the motor has less time to restore the energy. If the energy cannot be restored in time, the press stalls. The graph illustrates how the available energy of the press diminishes to 25% of the rated capacity when accompanied by a speed reduction from 24 strokes per minute to 12 strokes per minute.

Figure 3: A representative press-energy curve for a 600 ton mechanical press. Reducing the stroke rate from 24 to 12 reduces available energy by 75%.E-2
Case Study: Press Force and Press EnergyH-3
Predicting the press forces needed initially to form a part is known from a basic understanding of sheet metal forming. Different methods are available to calculate drawing force, ram force, slide force, or blankholder force. The press load signature is an output from most forming-process development simulation programs, as well as special press load monitors. The topic of press force predictions will be covered in this Blog in the months ahead.
Most structural components include design features to improve local stiffness. Typically, forming of the features requiring embossing processes occurs near the end of the stroke near Bottom Dead Center. Predicting forces needed for such a process is usually based on press shop experiences applicable to conventional steel grades. To generate comparable numbers for AHSS grades, forming process simulation is recommended.
In Citation H-3, stamping simulations evaluated the forming of a cross member having a hat-profile with an embossment formed at the end of the stroke (Figure 4). The study simulated press forces and press energy involved for drawing and embossing a channel section from four steel grades approximately 1.5 mm thick: mild steel, HSLA 250/350, HSLA 350/450, and DP 350/600. Figures 5A and 5B clearly show that the embossing phase rather than the drawing phase dominates the total force and energy requirements, even though the punch travel for embossing is only a fraction of the drawing depth.

Figure 4: Cross section of a component having a longitudinal embossment to improve local stiffness.H-3
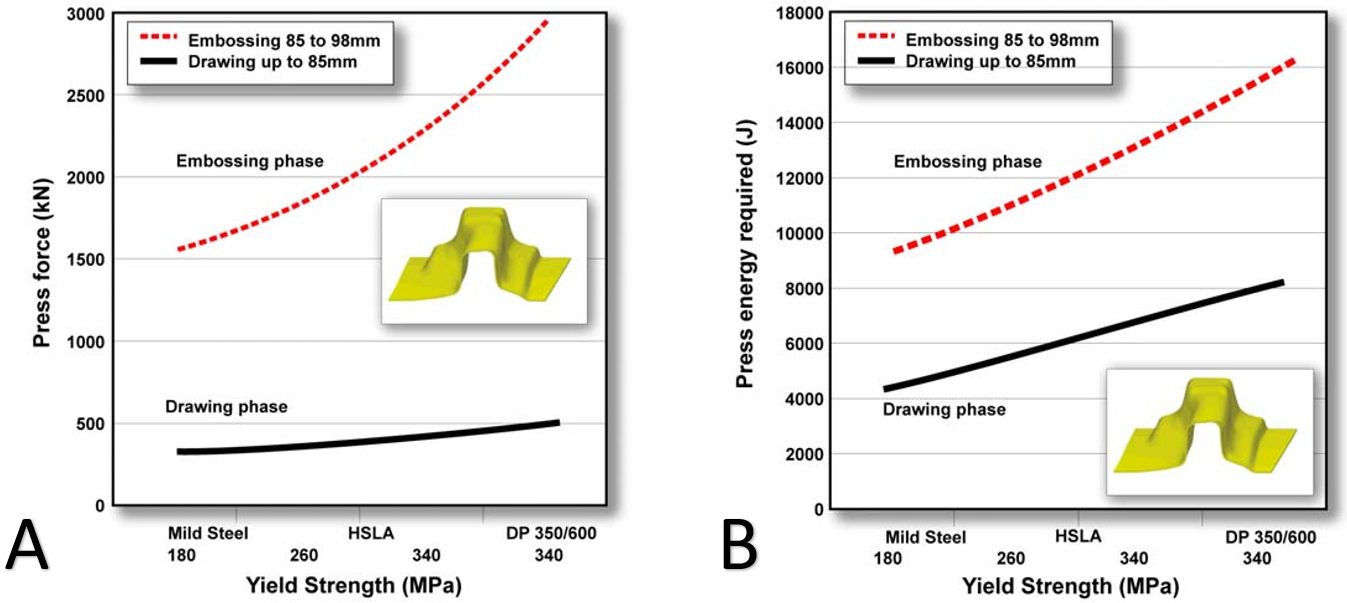
Figure 5: Embossing requires significantly more (A) force and (B) energy than drawing, even though the punch travel in the embossing stage is much smaller.H-3
Figures 6 and 7 highlight the press energy requirements, showing the greater energy required for higher strength steels. The embossment starts to form at a punch displacement of 85 mm, indicated by the three dots in Figure 6. The last increment of punch travel to 98 mm requires significantly higher energy, as shown in Figure 7. Note that compared with mild steel, the dual phase steel grade requires significantly more energy to form the part to home with the 98 mm travel.

Figure 6: Energy needed to form the component increases for higher strength steel grades. Forming the embossment begins at 85 mm of punch travel, indicated by the 3 dots.H-3

Figure 7: Additional energy required to form the embossment increases for higher strength steel grades.H-3
It is not only embossments that require substantially more force and energy at the end of the stroke. Stake beads for springback control engage late in the stroke to provide sidewall stretch. Depending on the design of the forming process, the steel into which the stake beads engage may have passed through conventional draw beads for metal flow control, and therefore are work-hardened to an even higher strength. This leads to greater requirements for die closing force and energy. Certain draw-bead geometries which demand different closing conditions around the periphery of the stamping also may influence closing force and energy requirements.
A more detailed Press Requirements article contains additional information and case studies. Read it here >>>
Resistance Welding Steel to Aluminium
This article summarizes a paper entitled, “Process, Microstructure and Fracture Mode of Thick Stack-Ups of Aluminum Alloy to AHSS Dissimilar Metal Spot Joints”, by Luke Walker, Colleen Hilla, Menachem Kimchi, and Wei Zhang, Department of Materials Science and Engineering, The Ohio State University.W-9
Researchers at The Ohio State University studied the effects of adding a stainless steel (SS) insert to a dissimilar Advanced High-Strength Steel (AHSS) to aluminum (Al) resistance spot weld (RSW). The SS insert was ultrasonically welded to the Al sheet prior to the RSW being performed. The purpose of the SS is to reduce the intermetallic layer that forms when welding steel to aluminum. This process increases the strength and toughness of the weld. In this study, the process is applied to three sheet (3T) stack up that contains one Al sheet and two 1.2 mm thick Press Hardened (PH) 1500 sheets. The joint strength is measured in lap shear testing and the intermetallic thickness/ morphology is studied after cross sectioning the welds.
During the microstructure evaluation it was noted that Al 6022 contained a larger nugget diameter as compared to the Al 5052 welds. A few potential reasons for the hotter welds were proposed including cleanliness of the electrodes, surface oxides, and thickness of the different alloys. The welds on the Al 5052 stack ups were made first on clean electrodes whereas the Al 6022 was made on potentially dirty electrodes that increased the contact resistance. The effects of different surface oxides are not likely given the SS sheet is ultrasonically welded but could still add to the higher heat input in the RSW. The Al 6022 is 0.2 mm thicker, which could increase the bulk resistance and decrease the cooling effect from the electrodes.
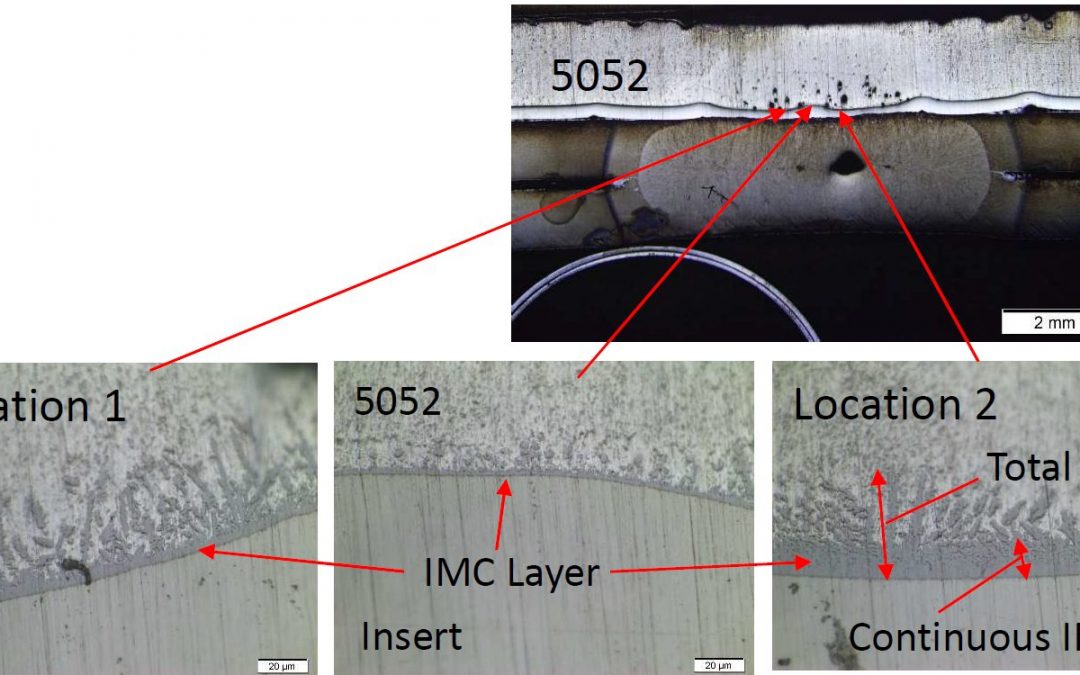
The 3T welds likely had much lower strength and toughness due to cracks that formed at the Al-SS insert interface. These can be attributed to an increase in intermetallic compound (IMC) thickness and the residual stress caused by the forge force. The IMC thickness was measured two ways: The first measurement was of the continuous IMC layer and the second was from the Al-Fe interface to the end of the IMC dendrites (Figure 1, 2 and Table 1). The Al 5052 observed the thickest continuous IMC layer but Al 6022 was close to the Al 5052 thickness. This can be attributed to the increased Si content of Al 6022 which has been shown to decrease the growth of Fe-Al intermetallics.
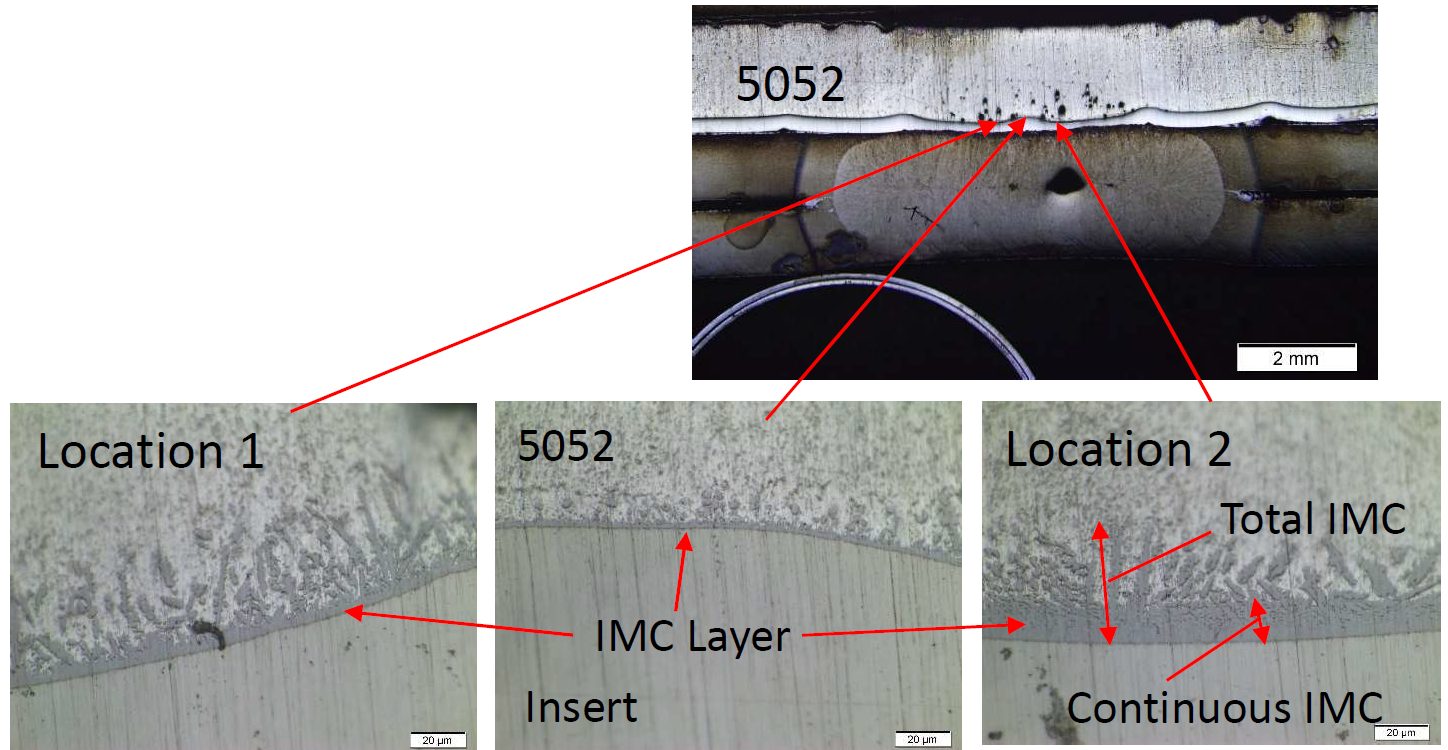
Figure 1: IMC in the Al Alloy 5052 to Stainless-Steel Weld.W-9
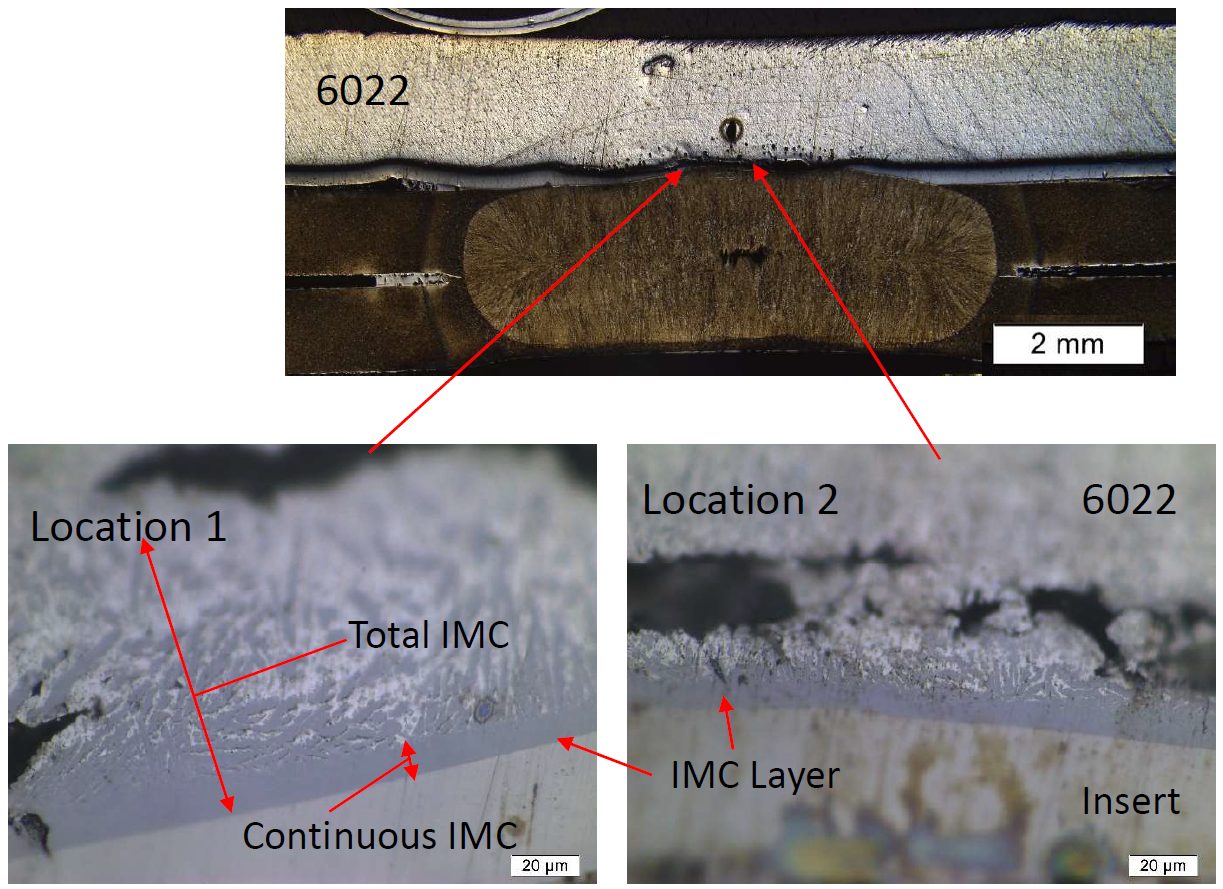
Figure 2: IMC in the Al Alloy 6022 to Stainless-Steel Weld.W-9
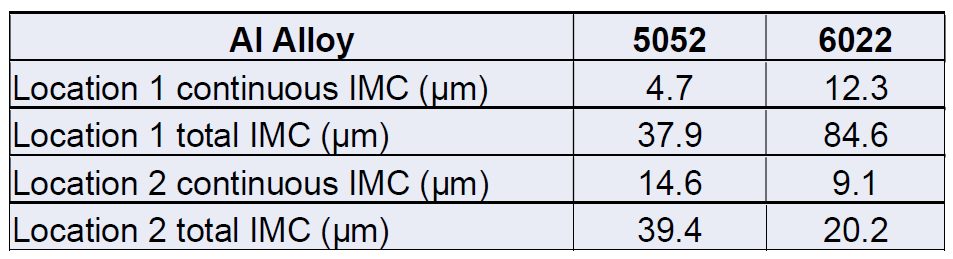
Table 1: IMC Thickness of Both the 5052 Weld and the 6022 Weld.W-9
Referencing Figure 3, the 2T stack-up has a higher tensile strength as well as significantly higher fracture energy absorbed compared to the 3T stack-ups. This is mainly attributed to the failure mode observed in the different stack-ups. The 2T welds had button pullout failure while 3T stack-ups had interfacial Failure.
![Figure 3: Failure Load and Fracture Energy [(A) Al to steel (Al-Us) welds and (B) steel to steel (Us-Us) welds (the 2T 6022 results are from previous work(10))]W-9](https://ahssinsights.org/wp-content/uploads/2021/12/fig4-process.jpg)
Figure 3: Failure Load and Fracture Energy [(A) Al to steel (Al-Us) welds and (B) steel to steel (Us-Us) welds (the 2T 6022 results are from previous work(10))]W-9
The Al 6022 contains higher Si content which likely decreased the growth of the continuous IMC layer but not the overall IMC layer (as seen in Figure 4 and Figure 5) due to higher weld temperatures. The joint strength of the welds in the 3T stack-ups were closer to the expected weld strength unless there was expulsion that caused a 5-kN drop in strength.
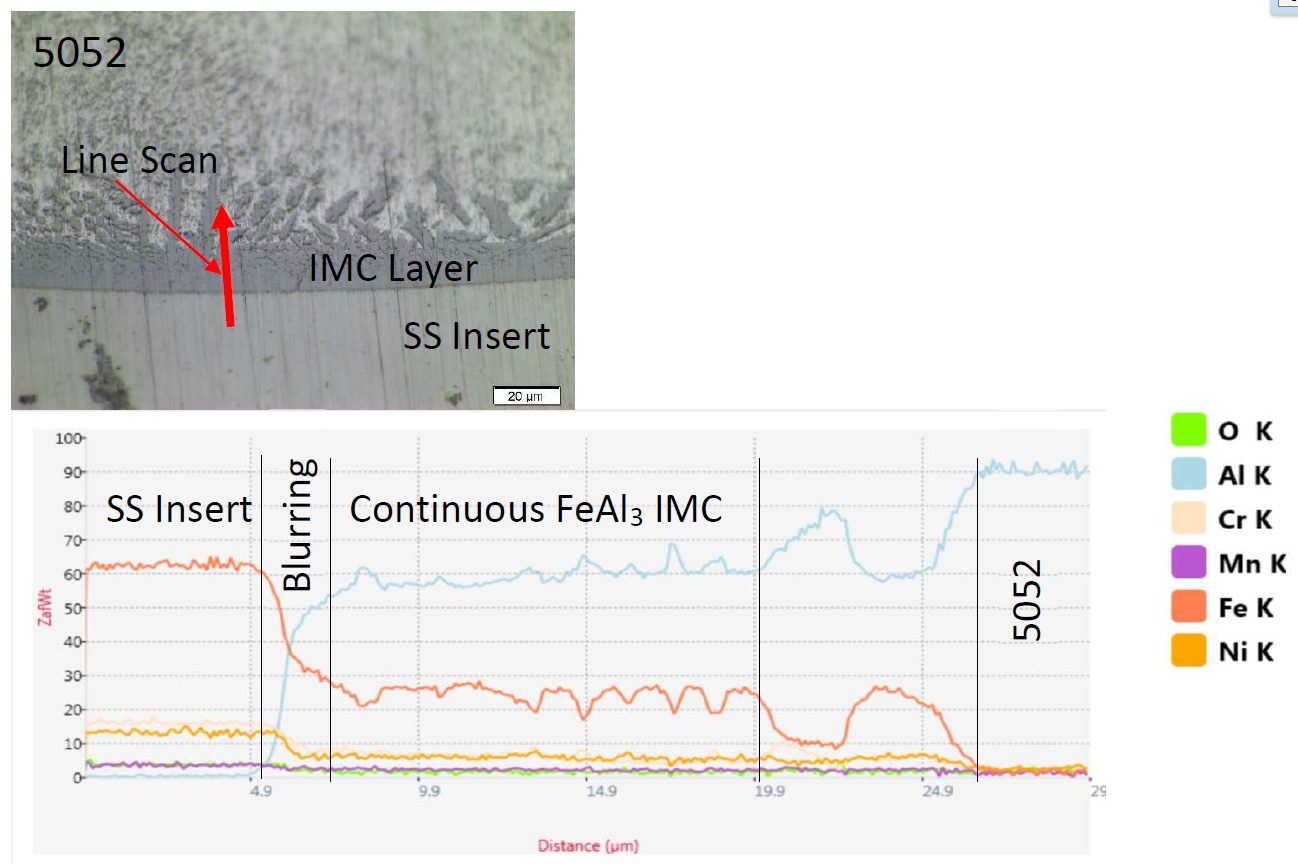
Figure 4: EDS Line Scan of the IMC in Location 2 on the 5052 3T Sample (SS stands for austenitic stainless steel 316).W-9
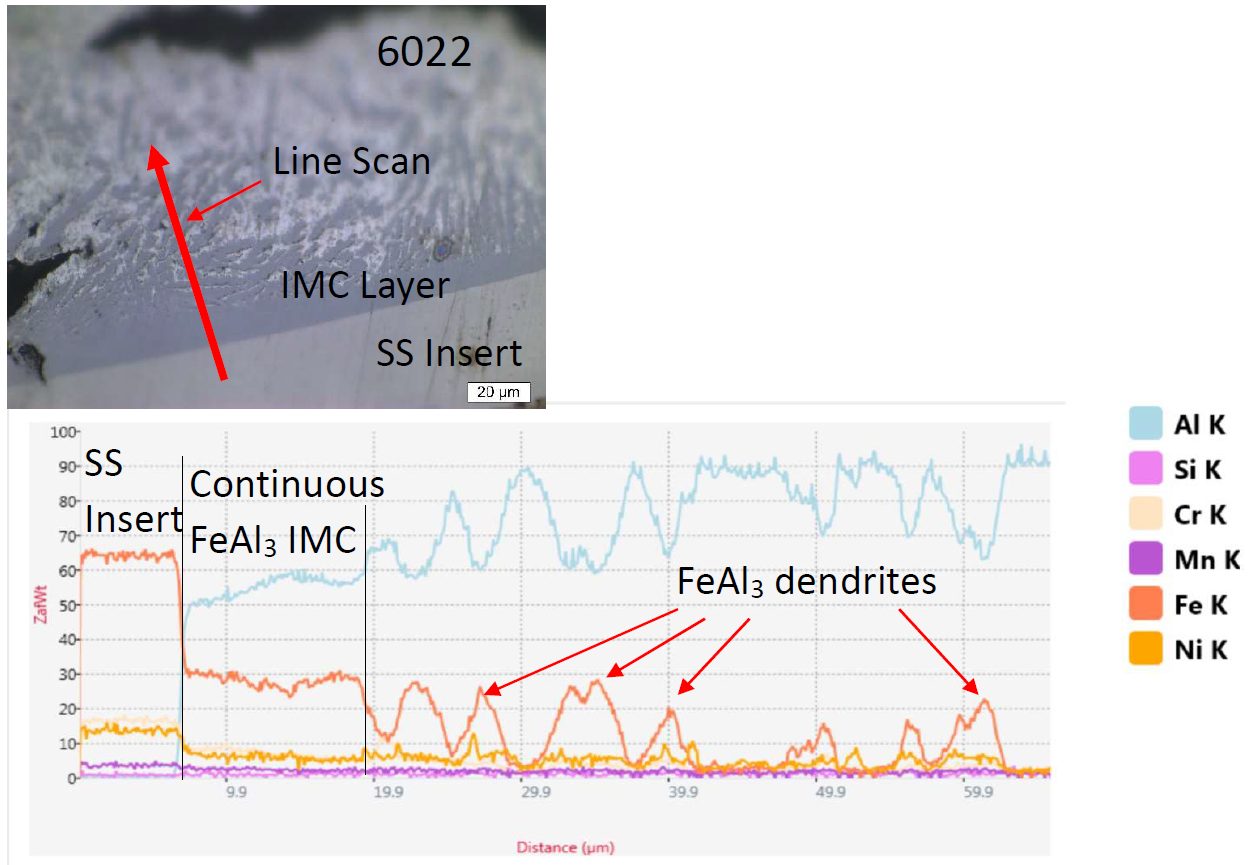
Figure 5: EDS Line Scan of the Intermetallic Layer at Location 1 on the 6022 3T Sample (SS stands for austenitic stainless steel 316).W-9
Citations
Citation:
W-9. Luke Walker, Colleen Hilla, Menachem Kimchi, and Wei Zhang, “Process, Microstructure and Fracture Moe of Thick Stack-Ups of Aluminum Alloy to AHSS Dissimilar Spot Joints”, AWS Sheet Metal Welding Conference XIX, Livonia, Mich., Nov. 2021.
Laser Welding
This article is a summary of the paper entitled, “IMPROVEMENT OF DELAYED CRACKING IN LASER WELD OF AHSS AND 980GEN3 STEELS”, by Linlin Jiang, Kyle Kram, and Chonghua Jiang.L-62
Researchers from AET Integration, Inc. worked on developing welding techniques that mitigated delayed cracking issues when laser welding Advanced High-Strength Steels (AHSS) and 3rd Gen AHSS. Stitch welds are most likely to have delayed cracking issues therefore the test specimen were cross tension samples with stitch welds. The test was run with ten specimens for each material with the same parameters. The specimen were visually inspected after welding in intervals from 30 min to 12 hours for 48 hours. The specimen were then inspected using X-ray analysis, cross-sectioning, and scanning electron microscope (SEM) analysis. Cracks were observed in the weld schedules used in Figure 1 and 2, and no cracking was observed in the welding schedules developed by researchers as seen in Figure 3 and 4 by altering parameters such as laser power, travel speed, beam oscillation, and defocusing techniques. The techniques are currently patent-pending and were not discussed in the research paper. Further validation tests on 3rd Gen steels is expected in the future.
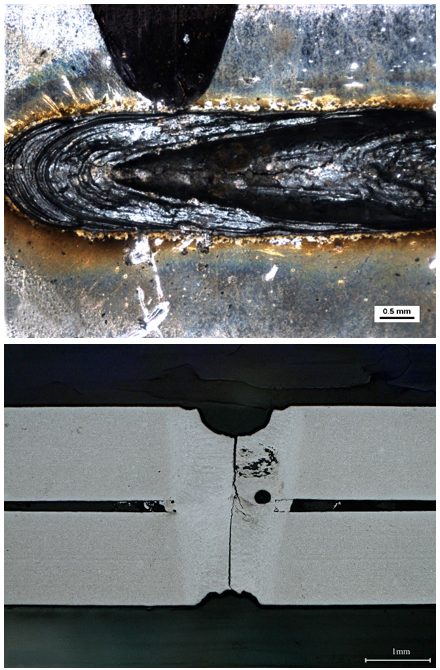
Figure 1: Delayed Crack in Weld of Material A. (Top) Crack from top surface, (Bottom) Cross Section of Crack.L-62
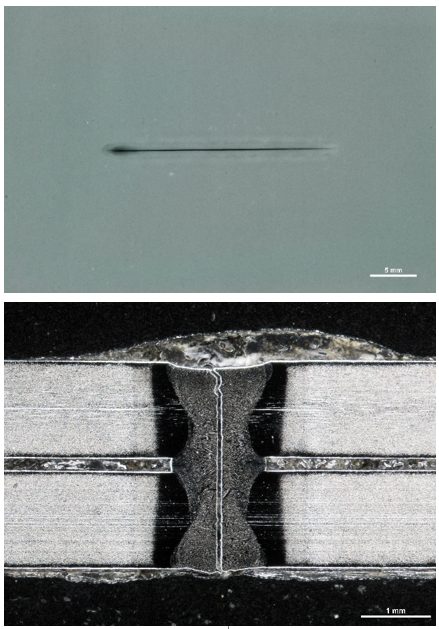
Figure 6: Delayed Cracking in Weld of Material B, (Top) X-ray, (Bottom) Cross section of crack.L-62
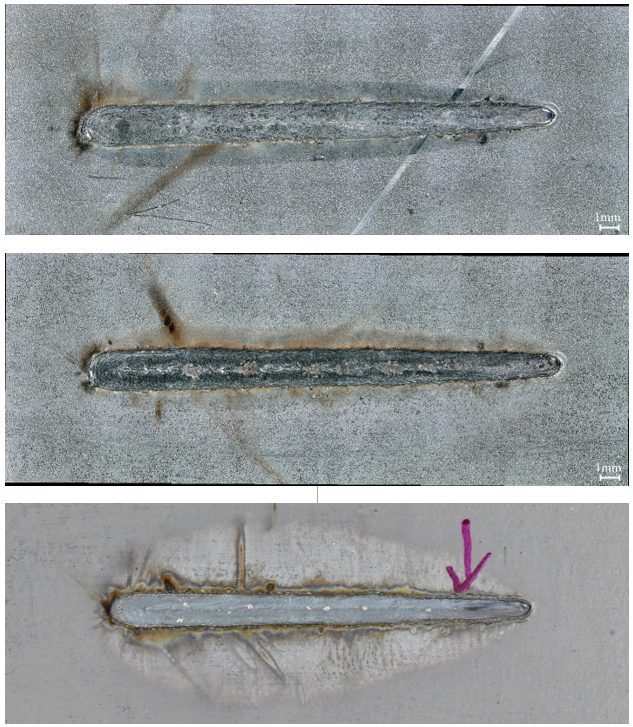
Figure 3: Examples of Visual Inspection Photographs. (Top) Top surface, Material A, (Middle) Top surface, Material B, (Bottom) Top surface, Material C.L-62
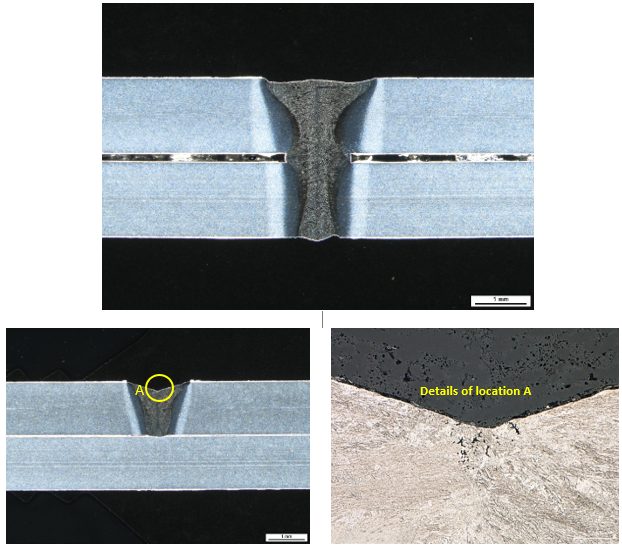
Figure 4: Examples of Cross Section Photographs. (Top) Cross section of weld center, Material A; (Bottom) Cross section of weld crater, Material A.L-62